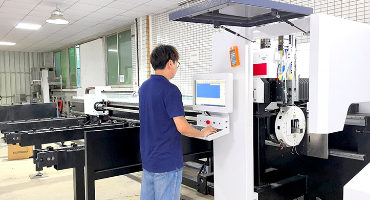
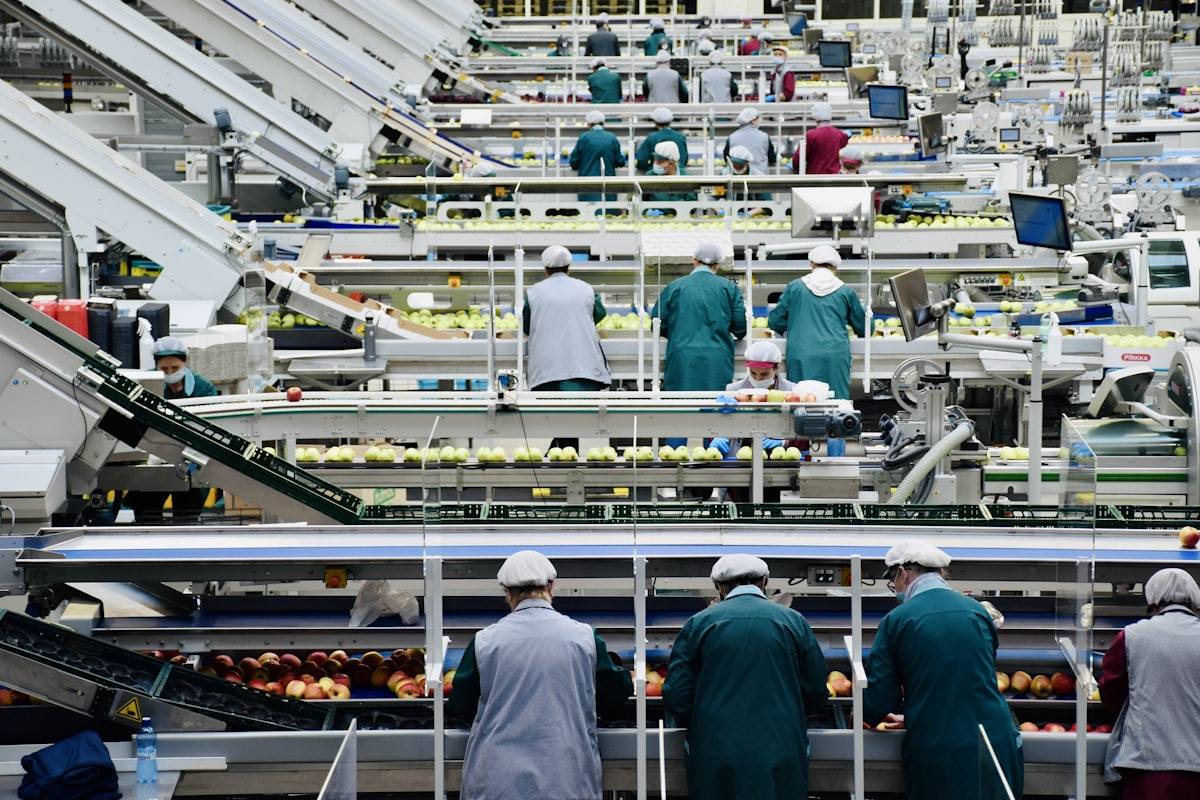
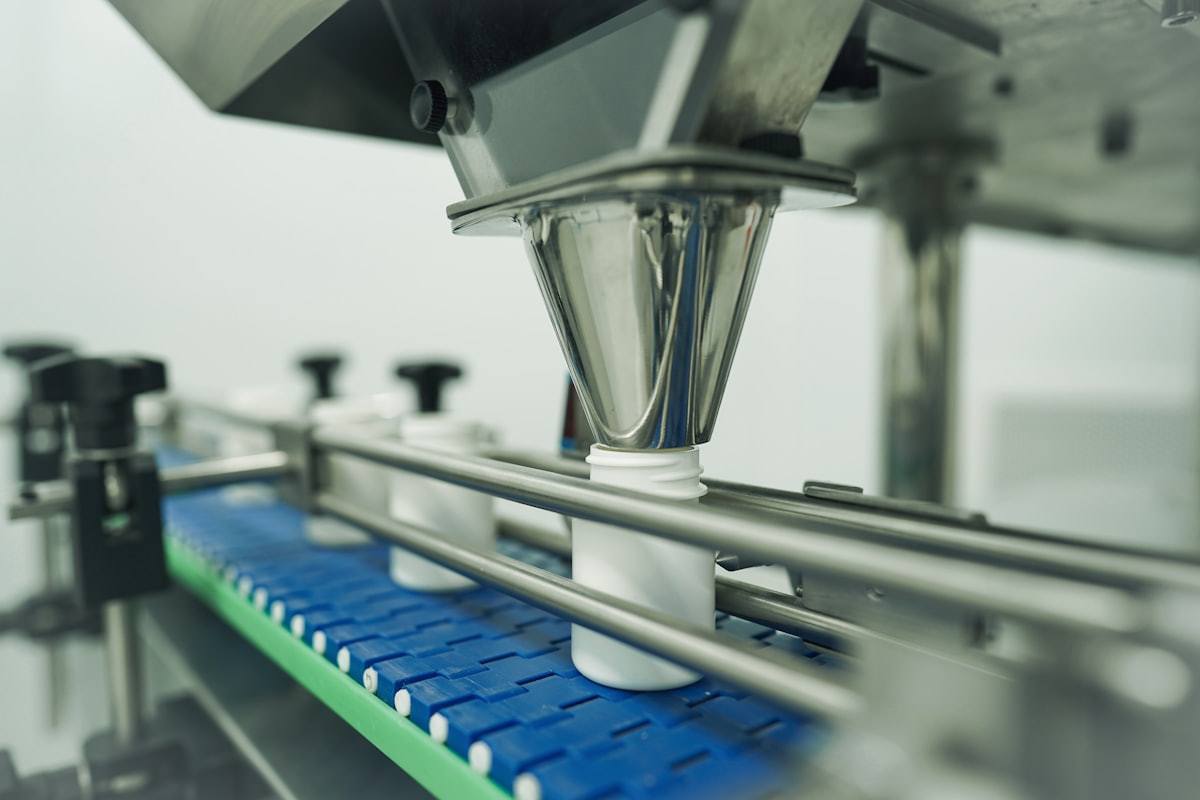
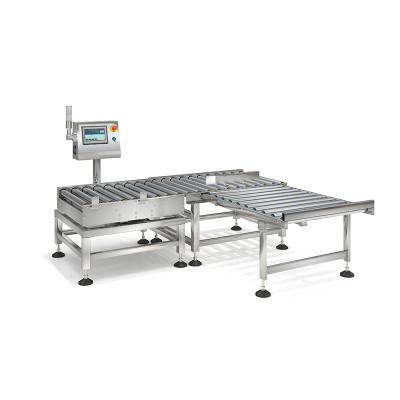
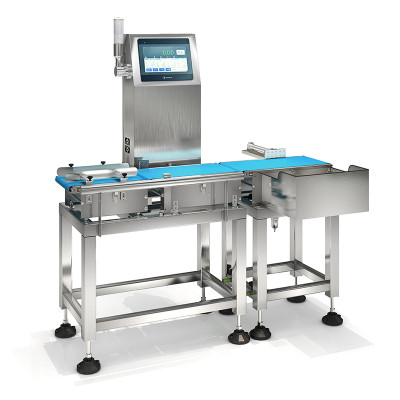
Our solutions help you manage every step of the packaging process, from checking the accuracy of package weight and contents to detecting unwanted substances such as metal and glass mixed in with the product.
Checkweigher ROI Calculator: Payback in 6-18 Months
Aug 5,2026
How long does a checkweigher take to pay for itself? If your line is currently overfilling by 0.5%–1.5%, the reference answer for a mid-size line is 6 to 18 months, not the "three months" your sales contact quoted. But that is not a fixed number — payback swings across orders of magnitude with line size and material value: a low-value, low-volume line can take years, while a high-value, high-throughput line pays back in weeks. Below you will find three preset production lines, one-click switching, and every formula fully disclosed, so you can see straight away how much profit you give away each year. This article also publishes equipment price bands and category-by-category overfill benchmarks, plus the part suppliers leave out: when this investment is simply not worth making.
ROI Quick-Calc Panel: Three Typical Lines
Pick the case closest to your line. All eight variable values, the five-step substitution and the three result figures are shown in full. No email required, and the formulas below are open so you can run your own numbers.
ASmall condiment lineOverfill rate 2.0%
Annual giveaway cost$9,5048.6 t / years
Annual recovery with a checkweigher$7,60380%
Payback period7.9 months237 days
Input values
Target pack weight
Qn
100 g
Line speed
v
30 ppm
Running hours per day
h
8 h/day
Current average overfill
g
2 g/pack
Material cost
p
$1.10/kg
Production days per year
d
300 days
Giveaway recovery rate
r
80%
Equipment investment
I
$5,000
Five-step substitution
1N = v × 60 × h × d30 × 60 × 8 × 3004,320,000 packs
2W = N × g ÷ 10004,320,000 × 2 ÷ 10008,640 kg
3C = W × p8,640 × $1.10$9,504
4S = C × r$9,504 × 80%$7,603
5T = 12 × I ÷ S12 × $5,000 ÷ $7,6037.89 months
BMid-size powder lineOverfill rate 0.6%
Annual giveaway cost$181,44051.8 t / years
Annual recovery with a checkweigher$145,15280%
Payback period21 days0.70 months
Input values
Target pack weight
Qn
500 g
Line speed
v
60 ppm
Running hours per day
h
16 h/day
Current average overfill
g
3 g/pack
Material cost
p
$3.50/kg
Production days per year
d
300 days
Giveaway recovery rate
r
80%
Equipment investment
I
$8,500
Five-step substitution
1N = v × 60 × h × d60 × 60 × 16 × 30017,280,000 packs
2W = N × g ÷ 100017,280,000 × 3 ÷ 100051,840 kg
3C = W × p51,840 × $3.50$181,440
4S = C × r$181,440 × 80%$145,152
5T = 12 × I ÷ S12 × $8,500 ÷ $145,1520.70 months
CLarge food lineOverfill rate 1.4%
Annual giveaway cost$423,360121.0 t / years
Annual recovery with a checkweigher$338,68880%
Payback period7 days0.25 months
Input values
Target pack weight
Qn
250 g
Line speed
v
120 ppm
Running hours per day
h
16 h/day
Current average overfill
g
3.5 g/pack
Material cost
p
$3.50/kg
Production days per year
d
300 days
Giveaway recovery rate
r
80%
Equipment investment
I
$7,000
Five-step substitution
1N = v × 60 × h × d120 × 60 × 16 × 30034,560,000 packs
2W = N × g ÷ 100034,560,000 × 3.5 ÷ 1000120,960 kg
3C = W × p120,960 × $3.50$423,360
4S = C × r$423,360 × 80%$338,688
5T = 12 × I ÷ S12 × $7,000 ÷ $338,6880.25 months
Formulas and variables
Eight input variables
Variable
Symbol
Unit
Target pack weight
Qn
g
Line speed
v
ppm
Running hours per day
h
h/day
Current average overfill
g
g/pack
Material cost
p
$/kg
Production days per year
d
days
Giveaway recovery rate
r
%
Checkweigher investment
I
$
Five-step formula
1. Annual packs N = line speed v × 60 × daily hours h × operating days d
2. Annual giveaway W = N × overfill per pack g ÷ 1000 (kg/year)
3. Annual waste cost C = W × material price p
4. Annual recoverable S = C × recovery rate r
5. Payback period T = 12 × total investment I ÷ S (months)
First-year net gain = S − annual maintenance m
First-year ROI = (S − m) ÷ I × 100%
All three cases use the same formula and the same 80% recovery assumption; only scale and material value differ. Payback ranges from 7.9 months to 7 days, a spread of about 30x, which is exactly why no single industry-standard payback figure exists.
None of the three match your line? Send us your parameters and an application engineer will check the numbers for free.
The panel opens on the large production line (Preset C). Click A / B / C to switch between line sizes and compare against your own.
01The short answer first: payback for three typical production lines
How long a checkweigher takes to pay for itself depends on line size and material value. On a mid-size line overfilling by 0.5%–1.5%, payback is usually 6–18 months; a high-value, high-output line can pay back in weeks, while a low-value, low-volume line may need more than 3 years.
All three lines use the same formulas and the same 80% recovery assumption. The only differences are scale and material value.
Scenario
Line parameters
Equipment cost
Annual waste
Payback
A — Small seasoning sachet line
30 packs/min × 8 h/day × 300 days, 2 g overfill per pack, material $1.12/kg
$4,900
$9,677
~7.6 months
B — Mid-size powder line
60 packs/min × 16 h/day × 300 days, 3 g overfill per pack, material $3.50/kg
$8,400
$181,440
~0.7 months
C — Large food line
120 packs/min × 16 h/day × 300 days, 3.5 g overfill per pack, material $3.50/kg
$7,000
$423,360
~0.25 months
B and C are not arithmetic errors, and the equipment cost has not been understated. This is scale effect: the numerator is a few thousand dollars of hardware, while the denominator — annual packs × overfill per pack × material price — can differ by three orders of magnitude. Line A runs 4.32 million packs a year at $1.12/kg and gives away $9,677; line C runs 34.56 million packs at $3.50/kg and gives away $423,360. That is 43 times more, which is why one takes 7.6 months and the other takes just over a week.
So this question has no single answer. Third-party benchmarks are only anchors for mid-size lines: in cheese and confectionery, checkweigher payback is typically under one year (source: Minebea Intec / fponthenet.net), and the standard worked example in the literature is 11.4 months (source: Principles of Checkweighing).
Fig. 1: Once throughput and unit value rise, giveaway losses grow by orders of magnitude.
02How overfill (giveaway) actually happens
Overfill is not an equipment fault. It is the inevitable result of a rational decision made under physical constraints.
2.1 The natural spread of a filler: normal distribution and standard deviation σ
The output of a filler or multihead weigher is a distribution curve. Its width is described by the standard deviation σ, which comes from material density, millisecond-level valve variation and wear, and can never be driven to zero. To push the probability of underweight down to an acceptable level, the plant has only one lever: set the target value at declared quantity + 2σ (3σ if conservative). The larger σ is, the more product you give away. A checkweigher saves money through 100% inspection plus a feedback loop — narrowing the distribution so the target can safely move down — not by "weighing more accurately". How to measure σ in practice: weigh n consecutive packs and compute the sample standard deviation s = √[Σ(xᵢ − x̄)² ÷ (n − 1)]. The relative standard error of using s to estimate the population σ is roughly 1/√[2(n − 1)], so n of 20–30 is already stable enough. You do not need to weigh the whole batch.
Fig. 2: Lowering the filler target by just 0.5 g can save enough raw material annually to pay for a checkweigher.
2.2 Why plants would rather overfill: the cost of a negative deviation is far worse
The cost of underweight and the cost of overfill are completely asymmetric. Underweight means metrology penalties, batch detention, loss of the ℮ mark and delisting by retailers. Overfill (giveaway) costs only money — and it never appears in any accounting line item. It is absorbed into material consumption, where nobody is measured on it. So the supervisor always adjusts upward.
Beverage fillers are commonly set 2%–3% above nominal, and a mid-size plant loses around €180,000 a year as a result; a line producing 50 million units a year that cuts overfill from 3% to 0.5% can save more than €150,000 annually (source: Quality4Food, practitioner industry estimate). Newton's experience is that 3% can usually be brought down to 1%, which is equivalent to a 2% capacity gain at the same time (source: E&T Magazine / theiet.org).
2.3 The blind spot in sampling: why 0.1% sampling systematically underestimates overfill
Sampling inspection has two structural weaknesses. The sample is too small: pulling 5 packs per hour on a line producing 3,600 packs gives a 0.14% sampling rate, which is enough to catch a gross deviation but nowhere near enough to estimate the centre of the distribution. The timing is biased: QA usually samples during stable running, while overfill concentrates around batch changes, material changes, and restarts after cleaning. A Minebea Intec customer measurement confirms it: they believed they were giving away only 0.5 g per pack, and 100% inspection showed it was far more — with some product possibly non-compliant altogether (source: Minebea Intec / fponthenet.net). So the "current overfill" figure you enter before installing 100% inspection is almost certainly too low. If you want the true size of the prize, multiply by 1.5 and run the numbers again.
03The ROI formula, broken down item by item
Below is a line-by-line breakdown of how checkweigher ROI is calculated. Every formula can be reproduced in Excel — all you have to do is verify it.
3.1 Eight input variables: definition, unit, how to choose a value
Variable
Symbol
Unit
How to choose a value
Line speed
v
packs/min
Actual effective speed, not the nameplate rating
Daily running hours
h
hours/day
Effective run time, net of changeover, cleaning and downtime
Production days per year
d
days/year
Typically 250–300; do not use 360
Average overfill per pack
g
g/pack
Prefer the mean from 100% inspection; if you only have sampling data, see section 2.3
Material unit price
p
$/kg
Use marginal material cost — see below
Recovery rate
r
%
See section 3.3; do not simply assume 80%
Total equipment investment
I
$
Including installation and commissioning — see section 9.1
Annual maintenance cost
m
$/year
Roughly 3% of equipment price
Three of these are commonly filled in wrong. For material unit price, use marginal material cost: for bulk raw materials, use the delivered price; for multi-stage semi-finished goods, use the accumulated cost at the filling station, which is often more than 30% above the purchase price. For running hours, use effective run time — OEE on food lines is usually 60%–80%, so entering scheduled shift hours inflates annual pack count by around 20%. For production days, enter 250–300.
3.2 The core formulas: five steps to a payback period
(1) Annual packs         N = v × 60 × h × d               (packs/year)
(2) Annual overfill      W = N × g ÷ 1000                 (kg/year)
(3) Annual waste cost    C = W × p                        ($/year)
(4) Annual recoverable   S = C × r                        ($/year)
(5) Payback period       T = I ÷ (S ÷ 12) = 12 × I ÷ S    (months)

First-year net gain = S − m
First-year ROI      = (S − m) ÷ I × 100%
Substituting scenario C: N = 120 × 60 × 16 × 300 = 34,560,000 packs; W = 120,960 kg; C = $423,360; S = $338,688; T = 12 × 7,000 ÷ 338,688 = 0.25 months. Every step can be checked by hand — which is exactly why we can publish the formulas openly.
3.3 How to set the "recovery rate" without fooling yourself
The recovery rate r is not a guess. It has a precise physical meaning:
r = (current average overfill − achievable average overfill after installation) ÷ current average overfill
The "achievable average overfill after installation" is roughly the safety margin of the new system (2σ_new plus a drift allowance), determined by checkweigher accuracy, how adjustable the filler is, and how fast the closed loop responds. Example: current overfill is 3.5 g and the closed loop stabilises at 0.7 g, so r = (3.5 − 0.7) ÷ 3.5 = 80% — that is where the default comes from.
Three situations force r down: if the filler can only be adjusted manually, use 40%–60%; with many SKUs and frequent changeovers, use 50%–70%; if current overfill is already below 0.5%, use less than 30%. Under an ideal closed loop, accuracy can be held within 0.1 g of nominal (averaging about 20 packs before each correction), provided the filler accepts an external signal (source: Minebea Intec / fponthenet.net).
3.4 Three kinds of hidden gain the formula leaves out
The model only counts raw material. There are three further benefits that are real but hard to standardise, and we recommend listing them separately rather than mixing them into ROI: replacing manual sampling (frees 0.5–1 person per line), avoiding fines and recalls (a single event can cost several times the price of the machine), and fewer customer complaints and retailer rejections (chargebacks, delisting, audit downgrades). A rough quantification: manual replacement at 0.5–1 headcount × annual salary; a single fine or recall commonly reaching several times equipment cost; retailer complaint chargebacks estimated as contract deduction rate × annual supply value. Together these often shorten payback by another 10%–20% — but keep them on a separate line and out of the headline ROI.
04Industry overfill benchmarks: is your line normal?
Category-level overfill comparison data is almost impossible to find online, so we compiled the table below.
Whether an overfill rate is normal depends on the category: dry bulk foods 1.0%–3.0%, powders 1.5%–3.5%, liquids and sauces 0.5%–2.0%, frozen goods 2.0%–5.0%, high-value products 0.5%–2.0%. Anything above that range means there is room to compress.
4.1 Overfill rate by product category
Category
Typical overfill rate
Main causes
Achievable with a checkweigher
Dry bulk foods (chips / nuts / confectionery)
1.0%–3.0%
Inherent discreteness of multihead weighers, heavy individual pieces
0.5%–1.0%
Powders (milk powder / protein / seasoning powder)
Very high unit price — small absolute quantities, large amounts of money
0.2%–0.5%
What these numbers are: reference ranges for the industry, derived rather than measured, built from published worked examples, the structure of regulatory tolerances and filling process characteristics (typical σ per category, plus a 2σ safety margin, back-solved against the statutory TNE constraint). They are reliable for judging whether you are clearly on the high side. They are not a substitute for measuring your own line.
4.2 Why frozen goods and powders are inherently worse
For frozen goods, the problem is the glaze. Glaze weight varies and does not count toward net content, so at packing time nobody knows how many grams of the pack it represents and the only option is a blanket allowance. Add irregular frozen blocks and sublimation losses during storage, and getting below 2% is already an achievement.
For powders, the problem is the material itself. Bulk density shifts with moisture content, compaction and static charge, so the same auger revolution count can drift in discharge weight within a single day. Add dust interfering with sensors and nobody dares to cut the margin too fine.
Key insight: a high overfill rate does not mean a large loss. Loss = overfill rate × output × material price. Frozen goods have the highest overfill rate but cheap material; supplements may run at a third of that rate with a unit price 50 times higher, so the absolute loss is larger. That is precisely why a calculator is needed.
05Real checkweigher payback examples: three lines calculated in full
Here the three scenarios from section 1 are expanded, with every intermediate value shown so you can check each step.
5.1 Case A: small seasoning sachet line (low value + low volume)
30 packs/min, 8 h/day, 300 days, 2 g overfill per pack, material $1.12/kg, checkweigher $4,900. Annual packs 4.32 million, annual waste $9,677, annual recoverable $7,741, payback ~7.6 months. With a low unit price and small output, the overfill amount is limited, so the equipment price weighs heavily.
5.2 Case B: mid-size powder line (medium volume + medium-high value)
60 packs/min, 16 h/day, 300 days, 3 g overfill per pack, material $3.50/kg, checkweigher $8,400. Annual packs 17.28 million, annual waste $181,440, payback ~0.7 months. The equipment costs 70% more than in case A, yet payback is about one eleventh as long: output is 4× higher and unit price 3× higher, so annual loss differs by nearly 19×.
5.3 Case C: large food line (high volume + medium-high value)
120 packs/min, 16 h/day, 300 days, 3.5 g overfill per pack, material $3.50/kg, equipment $7,000. Annual packs 34.56 million, annual waste $423,360, payback ~0.25 months (about 7 days). Giving away 121 tonnes a year sounds absurd, but it is simply the arithmetic of 34.56 million packs × 3.5 g. A published worked example points the same way: a line running 27 million packs a year that removes 1 g per pack at $0.001/g saves $27,000 annually, or $115 per production day (source: Australian Food News).
The three cases span 7.6 months to 7 days — a factor of roughly 30. That is exactly why this article refuses to quote an "industry standard payback". The only meaningful approach is to substitute your own parameters.
06The compliance view: save money without crossing the line
Pushing the target value down saves money. Pushing it too far is illegal. Exporters in particular should read 6.4.
6.1 The EU ℮ mark and the three packer's rules
Following the definition and scope of the ℮ mark set out in the European Commission's "Your Europe" business compliance guide, prepackaged goods entering the EU must satisfy all three packer's rules at once:
The average actual content of the batch must not be less than the nominal quantity;
The proportion of packages with a negative error exceeding the TNE (tolerable negative error) must not exceed 2.5% — no more than 1 in 40;
Not a single package may have a negative error greater than twice the TNE. This is an absolute red line: one package fails the whole batch.
Nominal quantity Qn (g or ml)
Tolerable negative error TNE
5 – 50
9%
50 – 100
4.5 g/ml
100 – 200
4.5%
200 – 300
9 g/ml
300 – 500
3%
500 – 1000
15 g/ml
1000 – 10000
1.5%
Source: Council Directive 76/211/EEC, Annex I, point 2.4 (as amended by 78/891/EEC; consultable in the EUR-Lex legal database). It applies from 5 g–10 kg and 5 ml–10 L, and percentage values are rounded up to 0.1 g / 0.1 ml.
Example: for a 500 g jar of jam the TNE is 15 g, so no more than 2.5% of packs may fall below 485 g, and not one pack may fall below 470 g. Breaching rule 3 is far more serious than giving away a few extra grams.
6.2 OIML R87 and international mutual recognition
OIML R87, "Quantity of product in prepackages", is the international recommendation on which the EU average content system and most Asia-Pacific and Latin American regulations are modelled. It governs how much product should be in the pack: batch average, tolerable deficiency, and sampling acceptance plans.
Do not confuse it with OIML R51. R51 governs the metrological performance and accuracy class of the automatic catchweighing instrument itself. R87 governs the net content inside the pack. Look at R51 when selecting equipment, and at R87 when judging batch compliance — never mix the numbers. For combined metal detection, X-ray and checkweighing configurations by category, browse the SameGram inspection equipment technical blog.
6.3 Outside the EU: national schemes built on OIML R87
Internationally, OIML R87 (Net content of prepackages, 2016) is the model recommendation that most Asia-Pacific and Latin American regulations follow, so the "average value plus tolerable deficiency" logic described in 6.1 transfers to those markets with only the tolerance table and the sampling plan changing. Practical consequence: before you set a target value for a non-EU market, confirm three things in the local metrology regulation — the deficiency band that applies to your nominal quantity, whether an absolute per-package limit exists, and which national labelling standard governs the declaration itself. Where a market has adopted R87 in full, a target value that satisfies the EU rules will normally satisfy it too.
6.4 The strictest-jurisdiction principle when exporting to several countries
When one line supplies several markets, the safest approach is to set the target value to the strictest jurisdiction: take the tightest TNE or tolerable deficiency across all markets, and take the strictest batch acceptance rule as well (usually the EU prohibition on twice-TNE packs). The price is slightly more overfill, but it beats the changeover and mixed-batch risk that comes with maintaining several parameter sets. You can price this "compliance insurance premium" with the section 3 formulas too: extra safety margin × annual packs × material price.
07Six common misconceptions about checkweigher ROI
Misconception 1: believing "pays back in three days" pitches. The problem is not the size of the claim — a large, high-value line genuinely can pay back in weeks (see case C). The problem is that the claim never states which parameters it assumes. A promise with no line speed, no overfill figure and no material price cannot be verified.
Misconception 2: the more accurate, the better. A ±0.05 g machine costs more than twice a ±0.5 g machine, but if the filler's own σ is 2 g the bottleneck is on the filling side, and a higher-accuracy checkweigher will not narrow the distribution. Measure σ first, then specify accuracy.
Misconception 3: looking only at equipment price and ignoring TCO. Installation and commissioning run at roughly 5%–20% of machine price, and annual calibration and maintenance at about 3% of CAPEX. Payback is only realistic once those are in the denominator.
Misconception 4: assuming it saves money by itself. A checkweigher that only rejects, without feeding back to the filler, is just a sorting tool — the target value never comes down. The saving comes from the feedback loop, not the rejection action. Purchasing should confirm the communication interface.
Misconception 5: treating the declared quantity as the target value. The target must be declared quantity plus a safety margin. Setting it equal to the declared quantity means roughly half your packs are underweight — that is a compliance incident, not a saving.
Misconception 6: assuming a passed sample means compliance. Sampling only supports statistical inference, whereas rule 3 is an absolute "not a single package" clause. Only 100% inspection can satisfy it.
08When we do not recommend buying one
Most suppliers will not write this section. If you fall into one of the four cases below, a checkweigher is probably not the best place for your money right now.
One: low-value, low-volume lines. 20 packs/min × 8 h × 250 days = 2.4 million packs a year, overfill already down to 0.8 g/pack, material $0.84/kg, so annual waste = 2,400,000 × 0.8 ÷ 1000 × 0.84 = $1,613. If the filler cannot be adjusted automatically, take a recovery rate of only 60%: annual recoverable $968, or about $81 a month. With equipment plus installation at $5,600, payback ≈ 69 months (about 5.8 years). At that point the money returns faster if you spend it upgrading the filler.
Two: current overfill already below 0.3%. The denominator is already small, and the closer you get to the physical limit, the higher the marginal cost of each further gram.
Three: the line is scheduled for rebuild or relocation within a year. Capacity, speed and conveyor height will all change, and the model you choose now will very likely not fit.
Four: many SKUs in small batches, with more than five changeovers a day. The closed loop never has time to converge, and the real recovery rate lands far below 80%.
Rule of thumb: if payback exceeds 36 months, improve the filling process first — do not buy a checkweigher.
Fig. 3: Compliance is not "close enough"; it requires controlling the statistical distribution of net contents for every batch.
09Specification and quotation checklist
9.1 Price band reference
Publicly listed FOB price bands from Chinese manufacturers, for budgeting purposes:
Machine type
FOB price band (USD)
Typical specification
Entry-level dynamic checkweigher
$2,800–4,000
±0.5 g, 1–1000 g, 60–120 pieces/min
Mainstream food line model
$4,500–8,000
±0.1–0.2 g, 3–1500 g
High-accuracy / high-speed model
$6,500–12,000
±0.05 g, 1–300 g, air-blast rejection
Metal detector + checkweigher combo
$3,000–7,200
Integrated, saves conveyor space
Wide-range / large items (cartons)
$4,500–12,000
0.05–20/30 kg, ±5–10 g
Weight sorter (multi-grade sorting)
$6,200–15,200
Multi-channel, poultry / seafood / produce
The mainstream landed range works out at roughly $4,900–11,200. Do not forget to add installation and commissioning (5%–20% of machine price) and annual maintenance (about 3% of CAPEX) to the ROI denominator. Manufacturing capacity and certifications affect lead time and after-sales support — see SameGram's manufacturing capability and factory credentials.
9.2 Seven documents to request from your supplier
FAT report — run on your actual product, not standard test weights;
Measured 2σ accuracy — the overfill margin at your target speed, not static accuracy;
Capacity and speed match — whether your heaviest pack still meets spec at top speed;
Rejection method and reject rate — pusher / air blast / swing arm, including false-reject and missed-reject rates;
IP protection rating — at least IP65 for washdown areas; check explosion protection in dusty environments;
Communication interface and protocol — whether it can close the loop with your filler (see misconception 4);
Spare parts and local service — lead times for load cells, belts and control boards.
Q1: How long does a checkweigher usually take to pay for itself?
On a mid-size line with 0.5%–1.5% overfill and equipment at $4,900–11,200, payback is usually 6–18 months. A high-value, high-volume line can pay back in weeks, while a low-value, small line may exceed 3 years.
Q2: How much does a checkweigher cost?
Entry-level FOB $2,800–4,000, mainstream $4,500–8,000, high-accuracy and high-speed $6,500–12,000 — a landed range of roughly $4,900–11,200, plus 5%–20% for installation.
Q3: What overfill rate counts as normal?
It depends on the category: dry bulk foods 1.0%–3.0%, powders 1.5%–3.5%, liquids and sauces 0.5%–2.0%, frozen goods 2.0%–5.0%, high-value products 0.5%–2.0%. Anything above that range means there is room to compress.
Q4: Can a checkweigher adjust the filler automatically?
Yes, provided the filler accepts an external signal for parameter adjustment. The checkweigher averages about 20 packs before sending a correction, and under ideal conditions accuracy can be held within 0.1 g of nominal.
Q5: Is the EU ℮ mark mandatory?
It is not mandatory. The ℮ mark is a voluntary sign of adherence to the average content system — the European Commission's "Your Europe" guide states explicitly that "The ℮-mark is not mandatory". But once you apply it, you must satisfy all three packer's rules and accept metrological supervision by the member states, or you are in breach.
Q6: What is the difference between a checkweigher and a weight sorter?
A checkweigher decides pass or fail and rejects out-of-tolerance packs, usually through a single reject station. A weight sorter grades by weight into multiple classes with multiple outlets, and is common in poultry, seafood and produce grading.
Q7: What is the practical difference between ±0.1 g and ±0.5 g accuracy?
The safety margin you can compress — roughly 2σ. A ±0.5 g machine needs about 0.8 g more margin than a ±0.1 g machine. On a line running 30 million packs a year, that is 24 tonnes of raw material.
11Conclusion
There is no standard answer to how long a checkweigher takes to pay for itself. Payback is a function of annual packs × overfill per pack × material price, and those three can differ by three orders of magnitude between real production lines. Any number of months somebody quotes you belongs to somebody else's line.
Go back to the three presets at the top, click the one closest to your line, and read the three figures directly: annual waste, annual recoverable amount, payback period. If the result surprises you, go back to section 3.1 and check your definitions. If it convinces you, the checklist in section 9.2 is ready to send to suppliers. If you are unsure about the parameters, contact our application engineers.
The data and charts on this page are free to cite. Please credit SameGram.